Vítejte!
Buřtíci to zařídí!
Jsme tři kluci – široký, široký a široký. Je s námi legrace a dokážeme Vám zpříjemnit den, večer, víkend a nebo ráno. Zajistíme dobré jídlo, super pití, přineseme originální nápad Vaší zábavě a postaráme se o to, abyste měli kde sedět, abyste nezmokli, a abyste dobře slyšeli a viděli. Zábava, zvuk, catering, technické zajištění. Nečekejte od nás, že Vám pošleme perfektní prezentaci s barevnými grafy, my se s Vámi radši o celé akci pořádně pobavíme a co dohodneme, to bude platit. Zajistíme masopusty, firemní dny, dětské dny, oslavy narozenin, svatby, rozvody, to jsme my. To jsou naše služby. Jediné, co neposkytujeme, jsou služby intimní, všichni tři jsme totiž šťastně ženatí. Jaroslav Doležálek, Jiří Hlaváč, Zdeněk Lukesle.

Zábava
Nudíte se? Objednejte si nás. Opakujte po nás – CHACHA, CHECHE, CHICHI, CHOCHO. Pobavíme i ty, kteří nemají smysl pro humor. Smějte se krásně. Zábava pro malé i velké. Více ve fotogalerii.
Catering
Catering z kvalitních a čerstvých surovin? Žádný problém. Nechte si vypracovat nabídku, která nezruinuje váš rozpočet… Více ve fotogalerii.
Technické zajištění
Ozvučíme, osvítíme, zakouříme… Více ve fotogalerii.
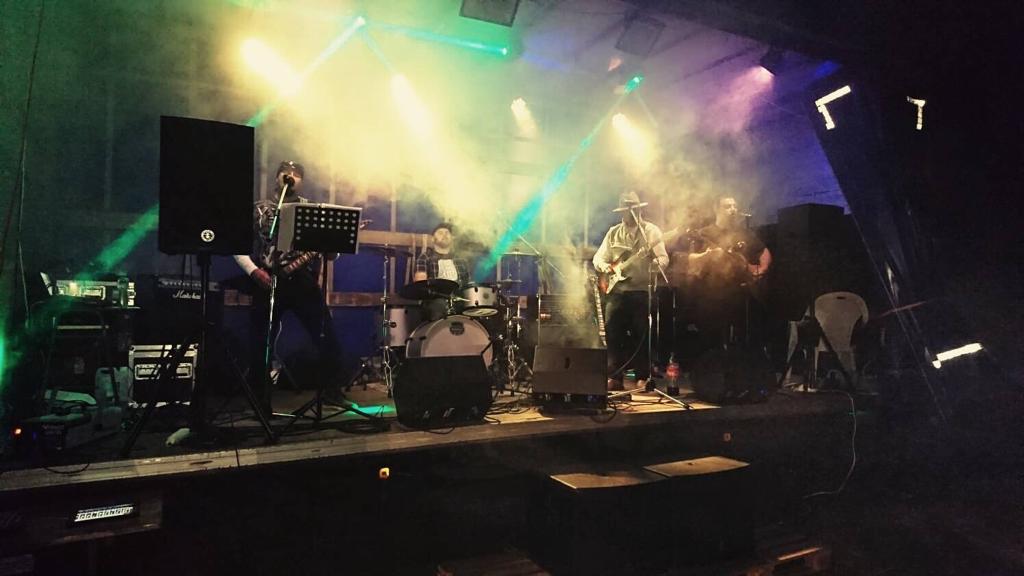
Jasně že Vaší akci zajistíme tak, že bude vše slyšet a vidět. Dokážeme Vám připravit celou akci tak, že se nebudete stresovat tím, jestli na Vás nevystartuje bubeník kapely, že se nevejde na pódium. Máme vlastní ozvučení na menší akce a to ostatní? Je zbytečný tady psát, že seženeme pódia taková a maková, zvuk pro pět nebo deset tisíc lidí. Asi Vám ani nic neřeknou značky používaných audio soustav a mikrofonů, nikoho nezajímá, jestli je reprobedna z Ameriky nebo Číny. Ale přesto za ta léta, co to děláme, máme kontakty na zvukaře, osvětlovače, kameramany, střihače, fotografy a máme i vlastní sexy klapku. A teď to nejdůležitější, spolupracujeme jen s těmi, kteří jsou v pohodě, usměvaví, na nic si nehrajou a jsou stejně krásní jako my. Prostě, když to budete chtít na akci víc nahlas nebo to ztišit, tak neudělají kyselý ksicht, ale rádi Vám vyhoví. Náš zákazník, náš pán. Náš zvukař, Váš kámoš. Jo a v příloze najdete pár ilustrativních fotek, jestli se Vám nebude líbit třeba barva pódia, tak Vám seženeme klidně růžový.
PS: A víte jaký je rozdíl mezi Pánem Bohem a zvukařem? Pán Bůh si nemyslí, že je zvukař.
Půjčovna
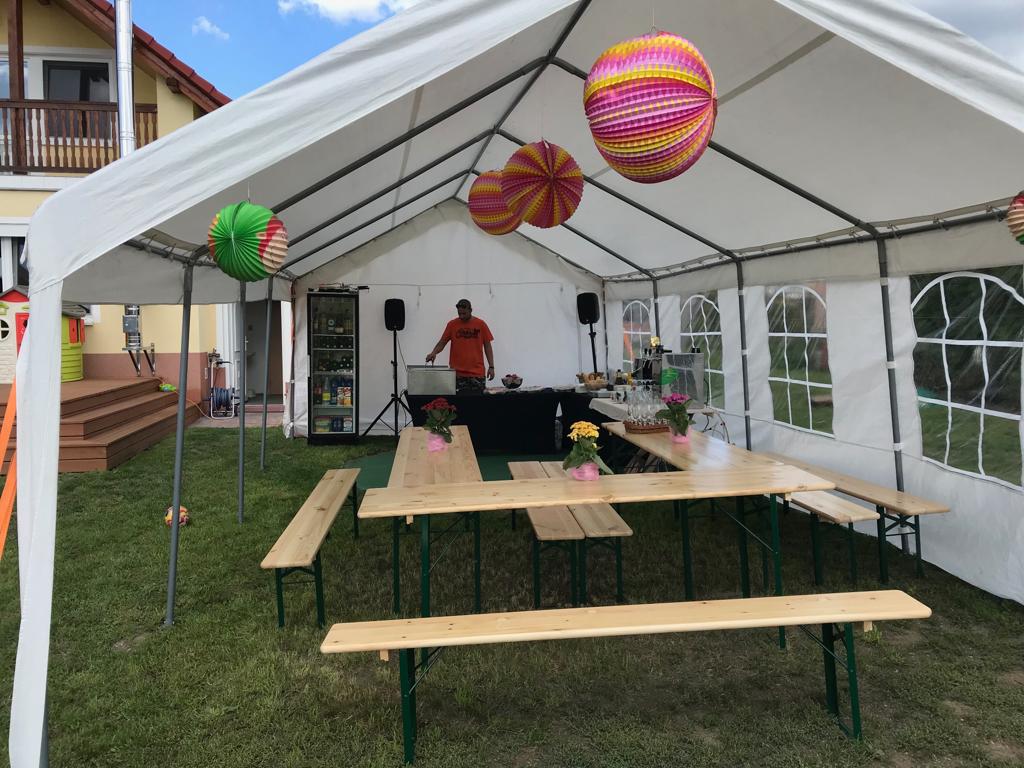
Půjčíme zahradní stan (4 x 8, 4 x 16, 4 x 10m), vytápěný profi stan s podlahou (vhodný pro obecní či firemní akci), párty sety a spoustu dalšího vybavení pro pořádání veřejných akcí. Více ve fotogalerii.
Kontakt
Vážení přátelé, jelikož jsme se nemohli dohodnout na tom, kdo je Buřtík 1, Buřtík 2 a Buřtík 3, tak každý z nás jsme Buřtík 1, vyberte si, komu se dovoláte:
Buřtík 1 – telefon 608 556 244
Buřtík 1 – telefon 777 120 035
Buřtík 1 – telefon 603 301 868
Mail: info(zavináč)burtici.cz
AKTUÁLNĚ
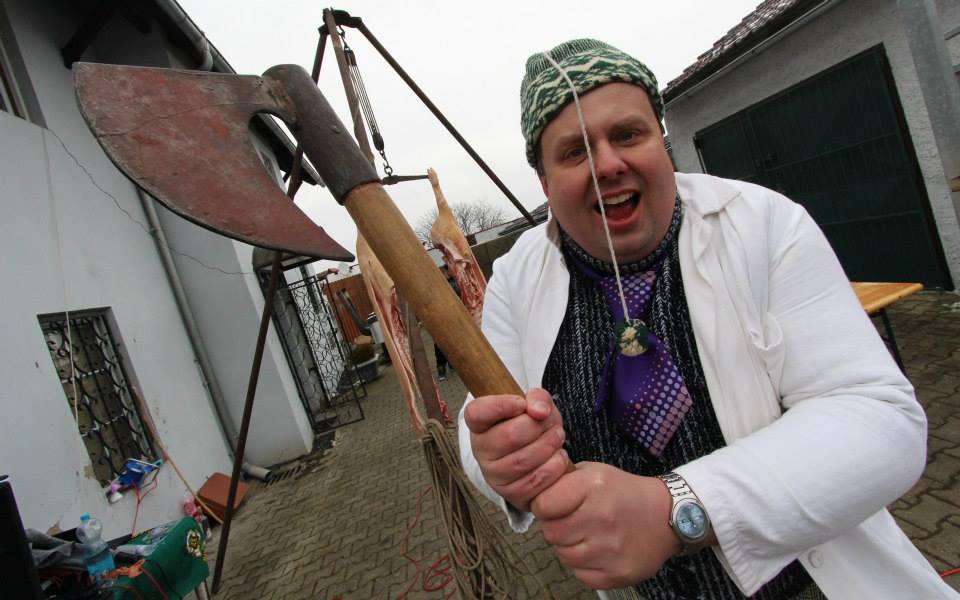
MASOPUST – MILUJEME ČESKÉ TRADICE – zajistíme Vám výbornou zabíjačku, přijedeme s naší starou polní kuchyní, všichni se budou olizovat, k tomu bude hrát pravá česká kapela a celou akcí Vás bude provázet řezník Krkovička, který si pro Vás připraví hodně veselé soutěže. Během našeho Masopustu nebude mít nikdo hlad.
Základní varianta: polní kuchyně s řezníkem, porcování a zpracování prasete, prodej zabijačkových výrobků. Cena zahrnuje ukázky ručního plnění jaternic a špejlování (workshopy). Vše si mohou klienti sami vyzkoušet a vyrobit si jaterničku vlastníma rukama.
Cena zahrnuje: prase cca 130 kg, veškeré suroviny potřebné k výrobě zabijačkových produktů (koření, kroupy, střeva… atd.) včetně přípravy, závěrečný úklid, likvidaci biologicky rozložitelných odpadů nevhodných k další spotřebě (č. 200 108).
Cena: 25.000 bez DPH
Uvedená cena je kalkulována na max. 50 lidí, každá další osoba se připlácí 250 Kč bez DPH na osobu.
Za příplatek zajistíme doprovodný program, který si můžete poskládat sami dle vašich představ. Moderátor – Zdeněk Lukesle z Hitrádia FM, který provede celou akcí, seznámí účastníky akce s tím, co je to Masopust, připraví veselé zabíjačkové soutěže a moderuje workshopy. Vše je možné doplnit originální retropárty – cena dle požadavků od 5.000 do 7.000,- Kč
Ozvučení akce – 5.000,-
Historické pódium – 5.000,-
Pohádka nebo program pro děti – od 4.000,- (dle zájmu klienta)
Kapela (harmonikáři, Švejk band a další možné nabídky) – od 5.000 do 12.000,-
Masopustní průvod plný masek – cena za masku a člověka – 1.500,-
Doprava do 100 km zdarma.
Nad 100 km účtujeme 10 Kč/km
Vše je kalkulováno v délce programu 4 hodiny.